
Bollinger Bands Trading Strategy: A Beginner-Friendly Guide to Smarter Trading | Trendy Traders
Introduction
Have you ever looked at a stock chart and wondered how traders predict price movements? It may seem complicated at first, but some tools make chart reading much easier. One of the most popular tools used by traders worldwide is the Bollinger Bands indicator.
Whether you are a beginner or someone trying to improve trading skills, understanding the bollinger bands trading strategy can help you identify trends, spot reversals, and manage risks more confidently.
Think of Bollinger Bands like road boundaries on a highway. When prices stay within the lanes, the market is stable. But when prices push outside the boundaries, it often signals something important is happening. Traders use these clues to make better decisions.
In this detailed guide, you’ll learn what is bollinger band, how it works, the bollinger band formula, popular trading setups, mistakes to avoid, and how proper stock market mentorship can accelerate your learning journey.
Learn the bollinger bands indicator, bollinger bands trading strategy, what is bollinger band, bollinger band formula, and stock market mentorship.
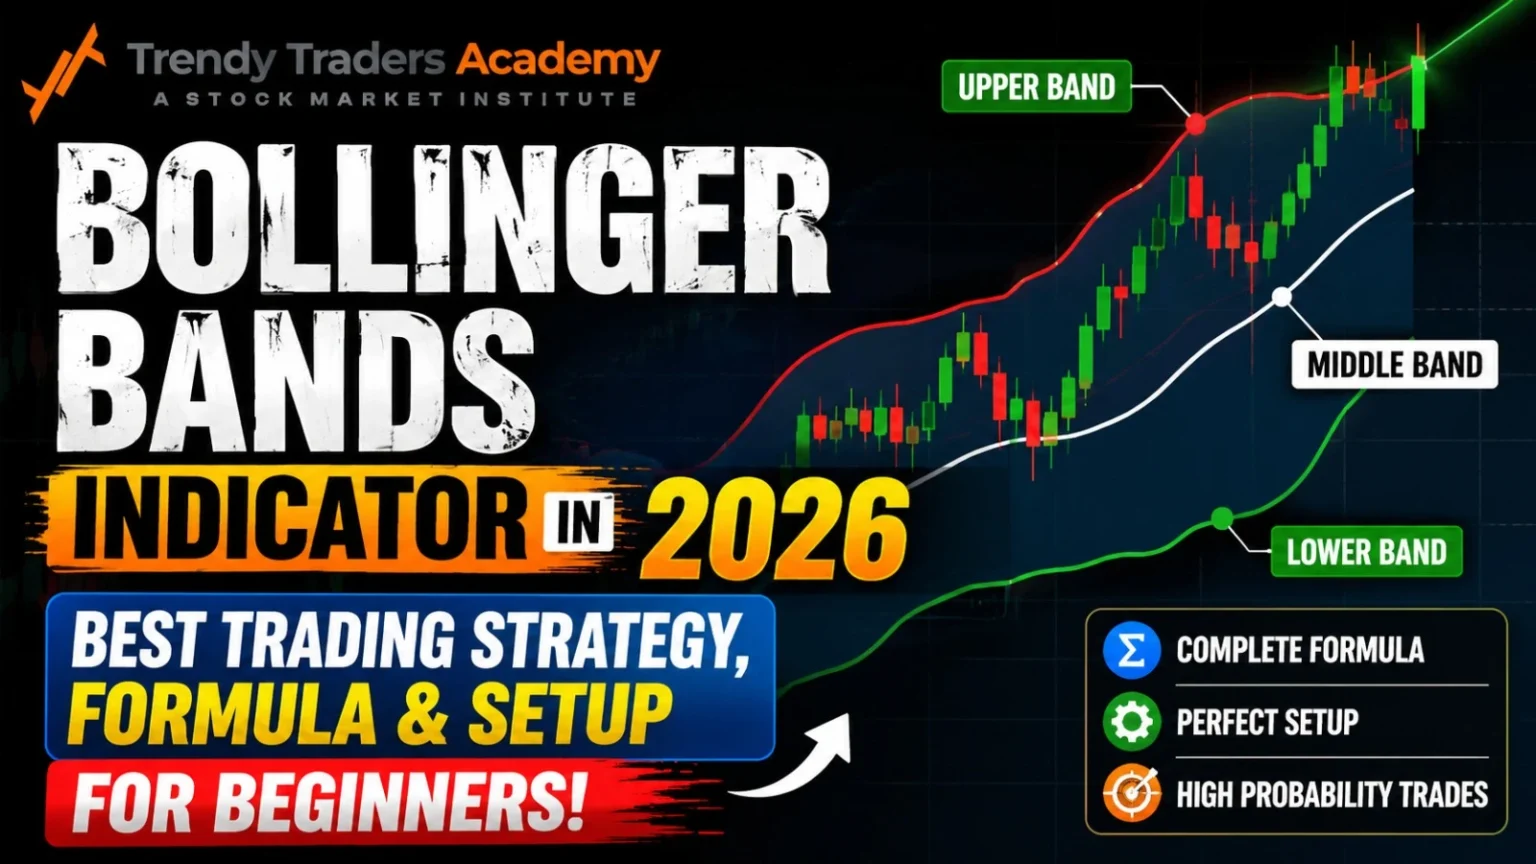
What is Bollinger Band?
The first question most beginners ask is: what is bollinger band?
Bollinger Bands are a technical analysis tool developed by John Bollinger in the 1980s. The indicator helps traders measure market volatility and identify possible buying or selling opportunities.
The Bollinger Bands indicator consists of three lines:
- Middle Band – Usually a 20-day moving average
- Upper Band – Moving average plus standard deviation
- Lower Band – Moving average minus standard deviation
When market volatility increases, the bands widen. When volatility decreases, the bands contract.
This simple structure gives traders valuable insights into market behavior.
History of the Bollinger Bands Indicator
The bollinger bands indicator was created by market analyst John Bollinger. Before this invention, traders struggled to measure volatility effectively.
John Bollinger combined moving averages with statistical concepts to create a flexible and easy-to-understand indicator. Over time, Bollinger Bands became one of the most trusted tools in stock trading, forex trading, and cryptocurrency markets.
Today, professional traders, investors, and beginners all use this indicator because it adapts to changing market conditions.
Understanding the Bollinger Band Formula
To truly master the indicator, you should understand the bollinger band formula.
Here is the basic structure:
Upper Band=SMA(20)+2σ\text{Upper Band} = SMA(20) + 2\sigmaUpper Band=SMA(20)+2σ
Lower Band=SMA(20)−2σ\text{Lower Band} = SMA(20) – 2\sigmaLower Band=SMA(20)−2σ
Where:
- SMA = Simple Moving Average
- σ = Standard Deviation
The moving average acts as the center line, while standard deviation measures how far prices move away from the average.
If prices become highly volatile, standard deviation increases, causing the bands to expand.
Components of Bollinger Bands
Middle Band
The middle band is typically the 20-period moving average. It shows the average price over a specific time frame.
Upper Band
The upper band indicates a potentially overbought market. However, it does not always mean prices will fall immediately.
Lower Band
The lower band may indicate oversold conditions. Traders often watch this area for possible buying opportunities.
Together, these bands help traders understand market momentum and volatility.
Why Traders Use Bollinger Bands
The bollinger bands indicator is popular because it serves multiple purposes.
Identifying Volatility
Narrow bands suggest low volatility, while wider bands signal high volatility.
Spotting Trends
Prices hugging the upper band may indicate a strong uptrend. Prices staying near the lower band can signal a downtrend.
Finding Entry and Exit Points
Many traders use the bands to identify possible buy and sell zones.
Works Across Markets
The indicator can be used in:
- Stocks
- Forex
- Commodities
- Cryptocurrency
- Indices
That versatility makes it highly valuable.
How to Read Bollinger Bands
Reading Bollinger Bands becomes easier with practice.
Price Near Upper Band
This usually signals bullish momentum.
Price Near Lower Band
This may indicate bearish pressure.
Bands Expanding
Volatility is increasing. Large price movements may occur.
Bands Contracting
The market is quiet. A breakout may be approaching.
One important thing to remember is that Bollinger Bands should not be used alone. They work best when combined with trend analysis and confirmation indicators.
Bollinger Bands Trading Strategy for Beginners
Now let’s explore a practical bollinger bands trading strategy beginners can use.
Simple Bounce Strategy
This strategy assumes prices tend to return toward the middle band.
Buy Signal
- Price touches lower band
- Market shows bullish candle confirmation
- Volume increases
Sell Signal
- Price touches upper band
- Bearish candle appears
- Momentum slows
This strategy works best in sideways markets.
Why It Works
Markets often move like a rubber band. When stretched too far, prices may snap back toward the average.
However, always use stop losses because trends can continue longer than expected.
Bollinger Band Squeeze Strategy
The Bollinger Band Squeeze is one of the most famous setups.
What is a Squeeze?
A squeeze happens when the bands become extremely narrow.
This signals low volatility and often comes before a major breakout.
How Traders Use It
Step 1
Identify tight bands.
Step 2
Wait for breakout confirmation.
Step 3
Enter trade in breakout direction.
Why It’s Popular
This strategy helps traders catch strong price movements early.
Imagine a spring being compressed tightly. Eventually, it releases with force. That’s exactly how market breakouts often behave.
Bollinger Bands Breakout Strategy
Breakout trading is another effective bollinger bands trading strategy.
Bullish Breakout
A bullish breakout occurs when price closes above the upper band with strong volume.
Signs of Strength
- Large bullish candles
- High trading volume
- Momentum indicators rising
Bearish Breakout
A bearish breakout happens when price falls below the lower band.
Signs of Weakness
- Strong selling pressure
- Consecutive bearish candles
- Weak market sentiment
Traders often combine breakouts with support and resistance analysis for better accuracy.
Reversal Trading Using Bollinger Bands
Reversal trading focuses on identifying turning points.
Double Bottom Setup
A common bullish reversal pattern:
- First price drop touches lower band
- Second drop stays above lower band
- Bullish reversal candle appears
This can signal weakening selling pressure.
Double Top Setup
A bearish reversal may occur when:
- Price hits upper band twice
- Momentum weakens
- Bearish candles appear
These setups become more reliable with additional confirmation indicators.
Combining Bollinger Bands with Other Indicators
Professional traders rarely rely on a single indicator.
Bollinger Bands + RSI
The Relative Strength Index (RSI) helps confirm overbought and oversold conditions.
Example
- Price touches lower band
- RSI below 30
- Possible buy opportunity
Bollinger Bands + MACD
The MACD indicator helps confirm trend direction.
Example
- Upper band breakout
- MACD bullish crossover
- Stronger trade confirmation
Bollinger Bands + Volume
Volume helps validate breakouts.
A breakout with low volume may fail quickly.
Common Mistakes Traders Make
Many beginners misuse the bollinger bands indicator.
Mistake 1: Assuming Every Touch Means Reversal
Prices can stay near the upper or lower band during strong trends.
Mistake 2: Ignoring Market Context
Always analyze overall market conditions before trading.
Mistake 3: No Stop Loss
Risk management is essential.
Mistake 4: Overtrading
Too many trades often lead to emotional decisions.
Mistake 5: Using One Indicator Alone
Combine Bollinger Bands with other tools for higher probability trades.
Learning from these mistakes can save both money and confidence.
Risk Management in Bollinger Bands Trading
Even the best bollinger bands trading strategy can fail without proper risk management.
Use Stop Loss Orders
Protect your capital on every trade.
Avoid Large Position Sizes
Never risk too much on a single trade.
Follow Risk-to-Reward Ratio
Aim for favorable setups where potential reward outweighs risk.
Stay Emotionally Disciplined
Fear and greed are dangerous in trading.
Consistency matters more than quick profits.
Importance of Stock Market Mentorship
Many traders struggle because they try learning everything alone.
Good stock market mentorship can dramatically shorten the learning curve.
Benefits of Mentorship
Structured Learning
You learn step-by-step instead of randomly watching videos.
Risk Management Guidance
Mentors teach practical trading discipline.
Emotional Support
Trading psychology is easier to manage with guidance.
Real Market Experience
Experienced mentors share lessons from actual market situations.
Think of trading mentorship like having a fitness coach. You may still need to do the hard work, but guidance helps avoid costly mistakes.
Final Thoughts on Bollinger Bands
The bollinger bands indicator remains one of the most powerful tools in technical analysis because it is simple, flexible, and effective.
By understanding what is bollinger band, learning the bollinger band formula, and practicing different setups, traders can improve decision-making and market awareness.
Still, no strategy guarantees profits every time. Successful trading depends on patience, discipline, risk management, and continuous learning.
If you are serious about becoming a better trader, combine technical knowledge with proper stock market mentorship and real-market practice.
The journey may take time, but consistent learning can build confidence and skill over the long term.
FAQs
1. What is the Bollinger Bands indicator used for?
The Bollinger Bands indicator helps traders measure volatility, identify trends, and spot possible buy or sell opportunities.
2. What is bollinger band in simple words?
Bollinger Bands are three lines plotted around price charts that help traders understand whether prices are high, low, or moving strongly.
3. What is the standard bollinger band formula?
The standard bollinger band formula uses a 20-period moving average with upper and lower bands placed two standard deviations away from the average.
4. Is Bollinger Bands trading strategy good for beginners?
Yes, beginners often use Bollinger Bands because the indicator is visually simple and works across many markets.
5. Can Bollinger Bands be used alone for trading?
While possible, it is better to combine Bollinger Bands with other indicators like RSI, MACD, and volume analysis for stronger confirmation.