
Most ecommerce dashboards are built around what’s easy to measure, not what actually matters. Pageviews, sessions, clicks — these metrics fill screens without driving decisions. The result is teams spending more time looking at dashboards than acting on them.
A well-designed ecommerce KPI dashboard is a fundamentally different thing. It surfaces the metrics that directly correlate with business outcomes, in a format that enables immediate action. Here’s what that looks like in practice — and how AI is making it dramatically easier to build.
What Belongs in an Ecommerce KPI Dashboard
The right metrics vary by role, but there are core categories every ecommerce KPI dashboard should address:
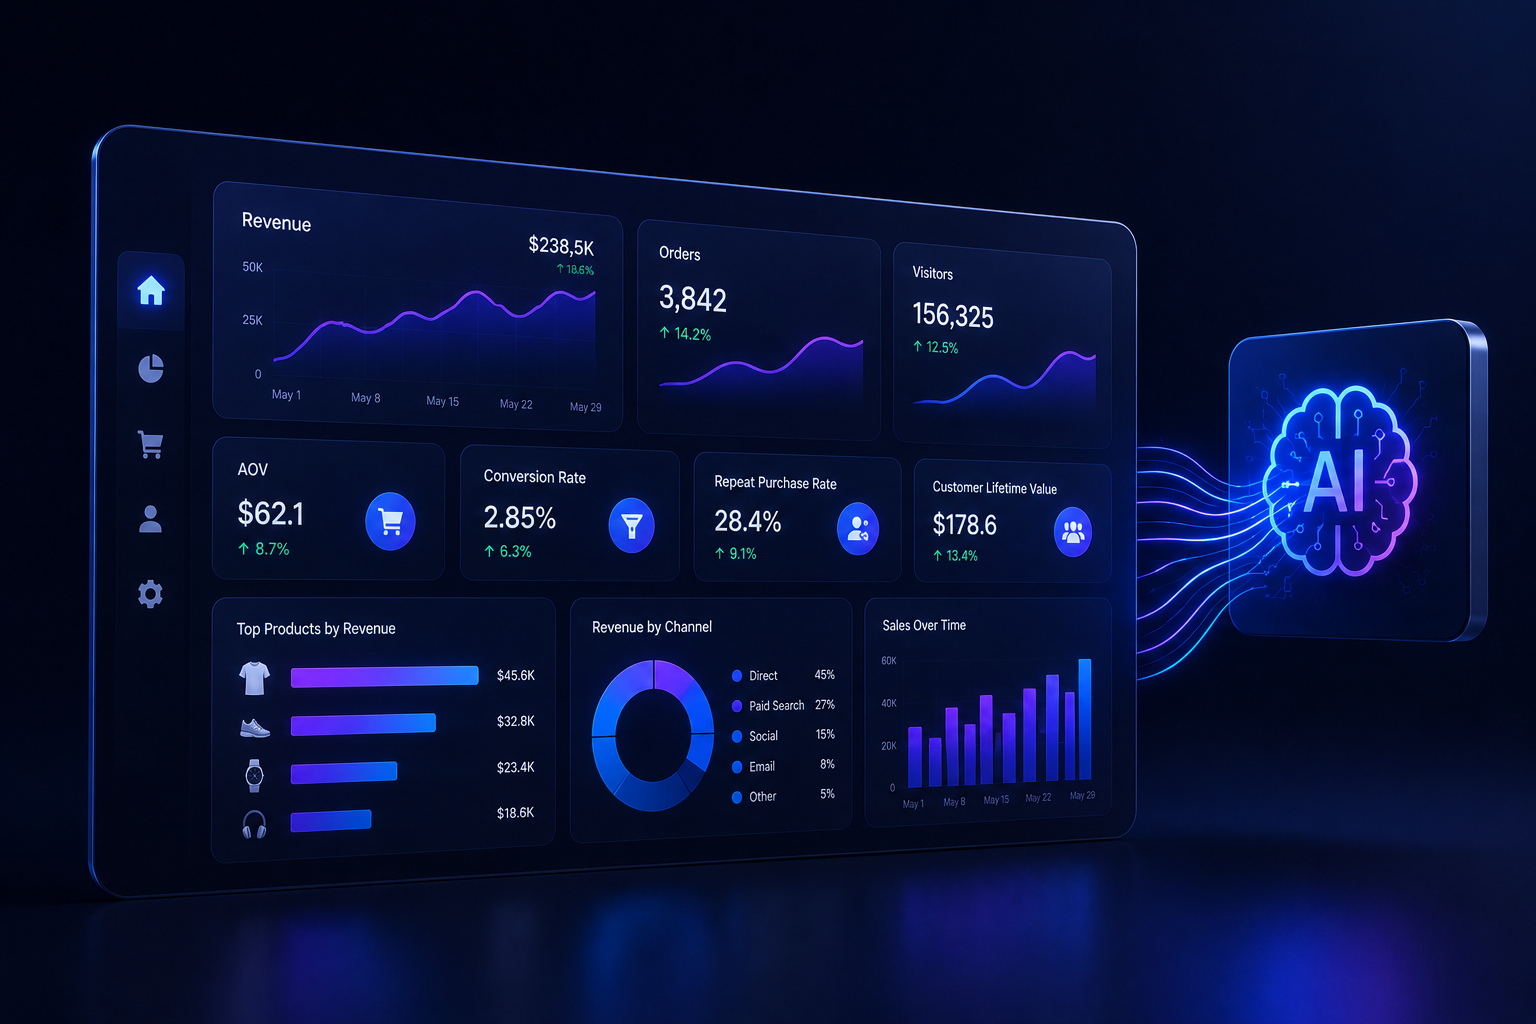
Revenue and Growth
- Total revenue (daily, weekly, monthly with trend lines)
- Revenue by channel (organic, paid, email, direct)
- Average Order Value (AOV) and trends
- Revenue per visitor
Conversion and Funnel
- Overall conversion rate by device and channel
- Cart abandonment rate with abandonment stage breakdown
- Checkout completion rate
- Product page to cart rate
Customer
- Customer Acquisition Cost (CAC) by channel
- Customer Lifetime Value (CLV) by cohort
- Repeat purchase rate
- Net Promoter Score (NPS) trend
Inventory and Operations
- Inventory turnover rate
- Stockout frequency by SKU
- Days of inventory remaining
- Return rate by product category
The Problem with Static Dashboards
Traditional dashboards are static by design: a data analyst or BI developer builds the views, and business users consume them. The problem is that business questions evolve faster than dashboards can be updated.
When your marketing team runs a new channel experiment, they need metrics that don’t exist in the current dashboard. When merchandising identifies a new trend, they need a custom view. The result is a constant backlog of dashboard requests — and decisions made without the right data.
Modern ecommerce kpi dashboard platforms solve this by combining pre-built templates with AI-powered customisation — so teams start with the most important metrics and can extend them without developer involvement.
How AI Changes Dashboard Creation
AI-powered dashboard tools change the creation model from build-then-use to ask-then-see. Instead of specifying the metrics, layout, and data sources to an analyst, a business user describes what they want to understand — and the AI builds the view.
This has several important implications:
- Dashboard creation time drops from weeks to minutes
- Non-technical users can build their own views without BI support
- Dashboards can be rebuilt on the fly as questions evolve
- AI can proactively suggest relevant metrics based on the business context
Self-Service Dashboard Design Principles
Whether you’re building dashboards manually or using AI to generate them, these principles should guide the design:
- One metric per widget: Avoid cluttered multi-metric charts that obscure the signal
- Context by default: Every metric should show a comparison (vs. last period, vs. goal)
- Drill-down enabled: Any summary metric should link to the underlying detail
- Mobile-first layout: Most business users will check dashboards on mobile at some point
- Anomaly highlighting: Surface deviations automatically so users don’t have to hunt for them
This is where self service data analytics platforms become essential — they give teams the ability to build and iterate on dashboards without relying on a centralised BI team for every change.
Role-Specific Dashboard Recommendations
CEO / Business Leader Dashboard
Focus: Revenue trend, gross margin, CAC vs CLV, channel mix. Frequency: Daily snapshot with weekly deep-dive.
Marketing Manager Dashboard
Focus: CAC by channel, ROAS, email revenue contribution, campaign conversion rates. Frequency: Real-time with daily summary.
Merchandising Manager Dashboard
Focus: Top/bottom performers by revenue and margin, inventory days remaining, sell-through rate. Frequency: Daily.
Customer Experience Manager Dashboard
Focus: CSAT, NPS, return rate, support ticket volume by category. Frequency: Weekly with real-time alerts.
Conclusion
An effective ecommerce KPI dashboard is not a collection of metrics — it’s a decision-making tool. Built right, it reduces the time between question and action, aligns teams around shared data, and surfaces the signals that drive competitive advantage. AI is making it possible to build these dashboards faster, keep them more current, and extend them as your business evolves.