
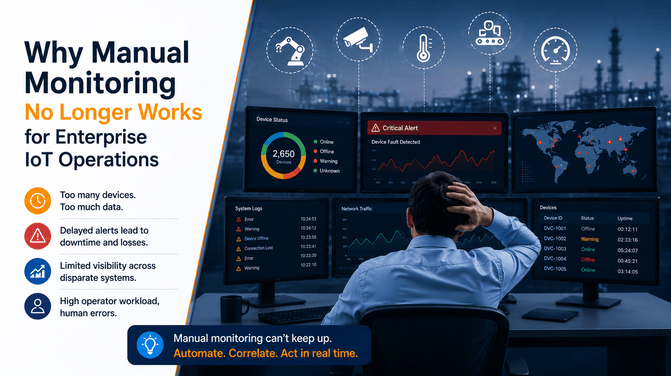
Enterprise IoT deployments have grown far beyond what spreadsheets, manual checklists, and periodic site visits were ever designed to handle. What once worked for a few hundred sensors on a single factory floor breaks down completely when an organization is running thousands of connected devices across multiple sites, regions, or even countries.
This is the moment many enterprises are realizing that manual monitoring isn’t just inefficient — it’s a genuine business risk. An IoT monitoring dashboard has become the standard answer: a centralized, real-time system that replaces guesswork with visibility, and reactive firefighting with proactive control.
This article breaks down why manual monitoring is failing at scale, what it’s costing enterprises, and what a modern IoT monitoring dashboard needs to deliver to solve the problem.
Why Manual Monitoring Is No Longer Sustainable for Enterprise IoT
Manual monitoring relies on people: checking logs, walking device floors, running periodic reports, and responding to problems after someone notices them. That model was tolerable when IoT fleets were small and low-stakes. It doesn’t scale for enterprise operations, where:
- Devices number in the thousands or tens of thousands, spread across multiple locations
- Data streams in continuously, not on a schedule a human can realistically review
- Failures can cascade quickly, affecting production lines, supply chains, or customer-facing services
- Compliance and audit requirements demand consistent, documented monitoring — not spot checks
Manual processes simply cannot keep pace with the volume, velocity, and complexity of enterprise IoT data. The result is blind spots, slow reactions, and rising costs — all of which compound as the fleet grows.
The Challenges of Managing Large-Scale Connected Devices
Managing connected devices at enterprise scale introduces a set of challenges that don’t exist — or are far less severe — in smaller deployments:
- Device heterogeneity: Enterprises often run equipment from multiple vendors, with different firmware versions, communication protocols, and data formats.
- Geographic distribution: Devices spread across factories, warehouses, retail locations, or field sites make physical inspection impractical.
- Data volume: Thousands of devices generating continuous telemetry produce far more data than any team can manually review.
- Network variability: Connectivity drops, latency spikes, and intermittent signals need to be distinguished from genuine device failures.
- Security exposure: Every connected device is a potential entry point, and manual processes struggle to track patch levels or anomalous behavior across a large fleet.
Without a centralized system, these challenges are typically discovered only after something has already gone wrong.
How Manual Monitoring Impacts Business Performance
Delayed Issue Detection
When monitoring depends on someone noticing a problem — during a scheduled check, a report review, or a customer complaint — there’s an inherent lag between when an issue starts and when it’s caught. In an enterprise environment, that lag can mean hours or days of degraded performance before anyone intervenes.
Increased Downtime
Delayed detection directly translates into longer outages. Without real-time alerts, teams often discover device failures only after they’ve already disrupted operations, requiring longer diagnostic and recovery cycles than if the issue had been flagged the moment it appeared.
Higher Operational Costs
Manual monitoring is labor-intensive. It requires dedicated staff time for checks, reporting, and troubleshooting — time that scales linearly (or worse) with fleet size. On top of labor costs, unplanned downtime, emergency repairs, and reactive maintenance all add expenses that a proactive system would largely prevent.
Limited Data Visibility
Spreadsheets and siloed logs make it difficult to see the full picture. Teams end up with fragmented, delayed, or inconsistent data, making it hard to spot trends, correlate issues across devices, or make informed decisions about capacity, maintenance, or investment.
Why Enterprises Are Moving to IoT Monitoring Dashboards
Given these pressures, enterprises are shifting toward centralized IoT monitoring dashboards that consolidate device data into a single, real-time view. This shift is driven by a few clear priorities:
- The need for real-time visibility across distributed, heterogeneous device fleets
- A push toward proactive maintenance instead of reactive firefighting
- Growing pressure to reduce operational costs tied to manual processes
- Increasing compliance and reporting requirements that manual methods can’t reliably satisfy
- The rise of AI-driven insights that require structured, continuous data feeds to function
An IoT monitoring dashboard isn’t just a convenience — it’s becoming the operational backbone that lets enterprises manage connected infrastructure at scale.
Key Features Every IoT Monitoring Dashboard Should Offer
Not every dashboard delivers the same value. Enterprises evaluating solutions should look for a specific set of core capabilities.
Real-Time Device Monitoring
Live status updates — not periodic snapshots — so teams can see device health, connectivity, and performance as it happens.
Centralized Dashboard
A single interface that aggregates data from every device, site, and vendor, removing the need to check multiple systems or spreadsheets to get a full picture.
Automated Alerts and Notifications
Configurable thresholds and automated alerts that flag anomalies, failures, or performance degradation the moment they occur, routed to the right team without manual review.
Performance Analytics and Reporting
Historical trend analysis, uptime tracking, and automated reporting that support both day-to-day operations and longer-term capacity or maintenance planning.
Business Benefits of Implementing an IoT Monitoring Dashboard
Enterprises that make this shift typically see measurable improvements across several areas:
- Faster issue resolution, since problems are flagged immediately rather than discovered after the fact
- Reduced downtime, as predictive and real-time alerts allow teams to intervene before failures escalate
- Lower operational costs, through reduced manual labor and fewer emergency repairs
- Better decision-making, backed by consistent, centralized data rather than fragmented reports
- Improved compliance, with automated logging and reporting that stands up to audits
- Scalability, since a dashboard can absorb fleet growth in a way manual processes cannot
Common Mistakes to Avoid When Modernizing IoT Monitoring
Enterprises moving away from manual monitoring often run into avoidable pitfalls:
- Choosing a dashboard that doesn’t scale — some tools work fine in a pilot but struggle under full enterprise device volume.
- Ignoring integration requirements — a dashboard that can’t connect to existing device protocols, ERP systems, or legacy infrastructure creates new silos instead of removing them.
- Overloading teams with alerts — poorly tuned alert thresholds lead to alert fatigue, where real issues get lost in noise.
- Underinvesting in training — even the best dashboard delivers little value if teams don’t know how to use it effectively.
- Treating it as a one-time project — monitoring needs evolve as the fleet grows; the dashboard and its configurations need ongoing review.
Future of Enterprise IoT Monitoring with AI and Predictive Analytics
The next stage of IoT monitoring is moving from real-time visibility to predictive intelligence. AI and machine learning models, layered on top of monitoring dashboards, can identify patterns that precede failures — flagging a device for maintenance before it actually breaks down, rather than after.
This shift toward predictive analytics allows enterprises to move from reactive and even proactive monitoring into true predictive maintenance, where interventions are scheduled based on data-driven forecasts rather than fixed schedules or manual observation. Combined with automation, this reduces both unplanned downtime and unnecessary maintenance work, further lowering costs while extending device lifespan.
Conclusion
Manual monitoring was never built for the scale, complexity, and speed of modern enterprise IoT operations. As device fleets grow, the gaps it leaves — delayed detection, rising costs, limited visibility — only get more expensive to ignore.
An IoT monitoring dashboard addresses these gaps directly, giving enterprises the real-time visibility, automated alerting, and analytics they need to run connected operations reliably at scale. As AI-driven predictive capabilities mature, the enterprises that have already centralized their monitoring will be best positioned to take advantage of them.
Frequently Asked Questions (FAQs)
1. What is an IoT monitoring dashboard?
An IoT monitoring dashboard is a centralized platform that collects, displays, and analyzes data from connected devices in real time, giving teams a single view of device health, performance, and alerts across an entire fleet.
2. Why is manual monitoring not effective for large IoT deployments?
Manual monitoring depends on human review of logs and reports, which can’t keep pace with the volume and speed of data generated by thousands of connected devices, leading to delayed detection and higher downtime.
3. What features should an enterprise look for in an IoT monitoring dashboard?
Key features include real-time device monitoring, a centralized interface, automated alerts and notifications, and performance analytics and reporting.
4. How does an IoT monitoring dashboard reduce operational costs?
It reduces the need for manual checks and emergency repairs by catching issues early, automating routine monitoring tasks, and supporting predictive maintenance instead of reactive fixes.
5. Can AI improve IoT monitoring dashboards?
Yes. AI and predictive analytics can identify patterns that precede device failures, enabling predictive maintenance and further reducing downtime and operational costs beyond what real-time monitoring alone can achieve.